Max Temperature
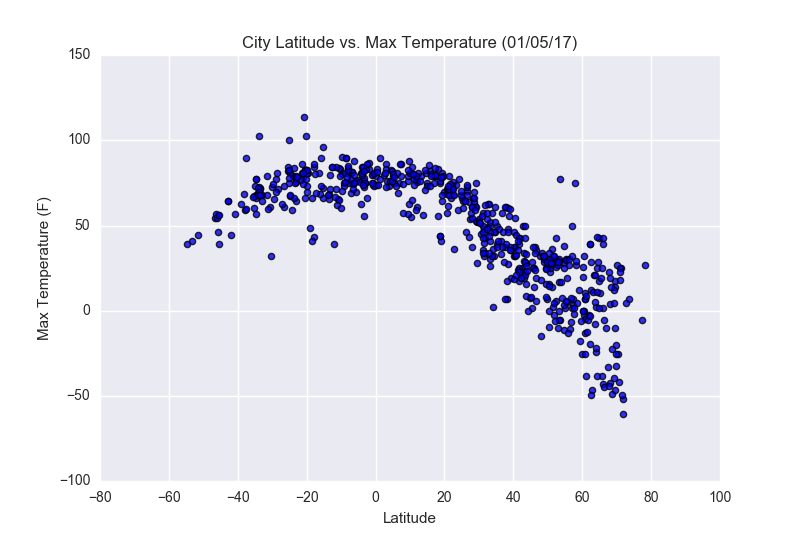
In this scatter comparison we show how temperature changes as latitude changes. We show an inverted porabola with 0 (degrees) looking to be the center. That makes sense as we'd expect the hottest temperatures closest to the equator.
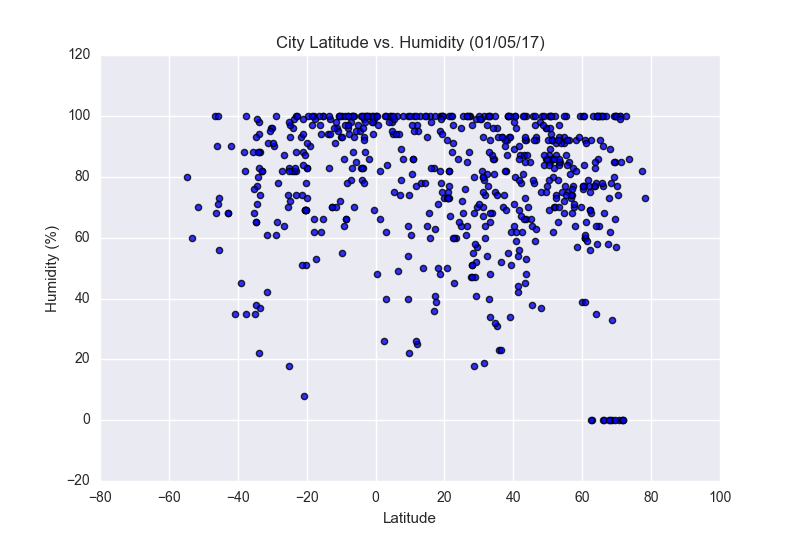
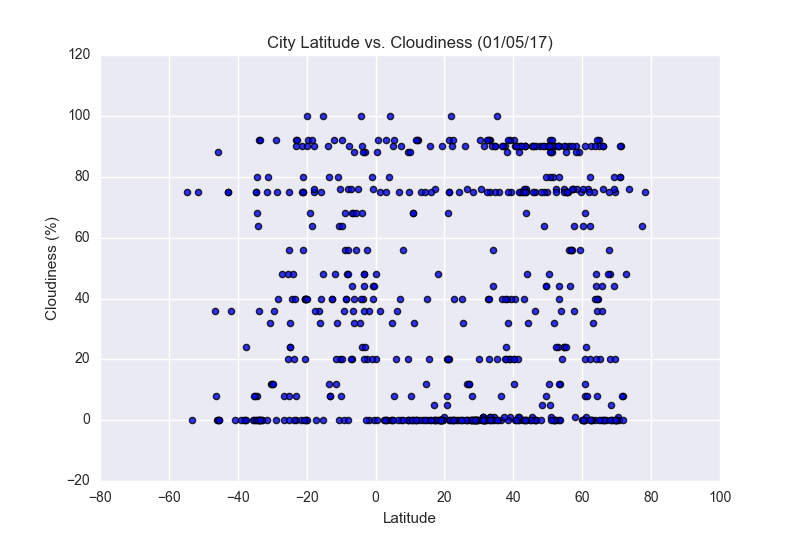
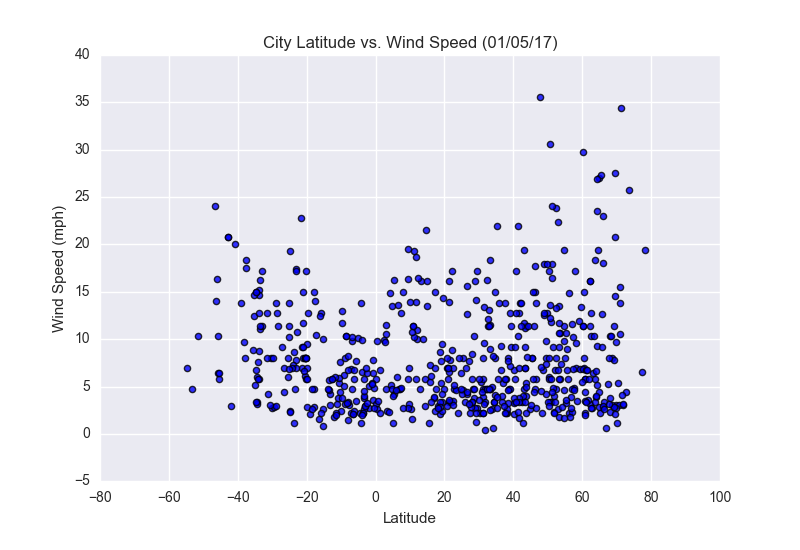
Visualizations